1-sample proportions test without continuity correction
data: 280 out of 500, null probability 0.5
X-squared = 7.2, df = 1, p-value = 0.00729
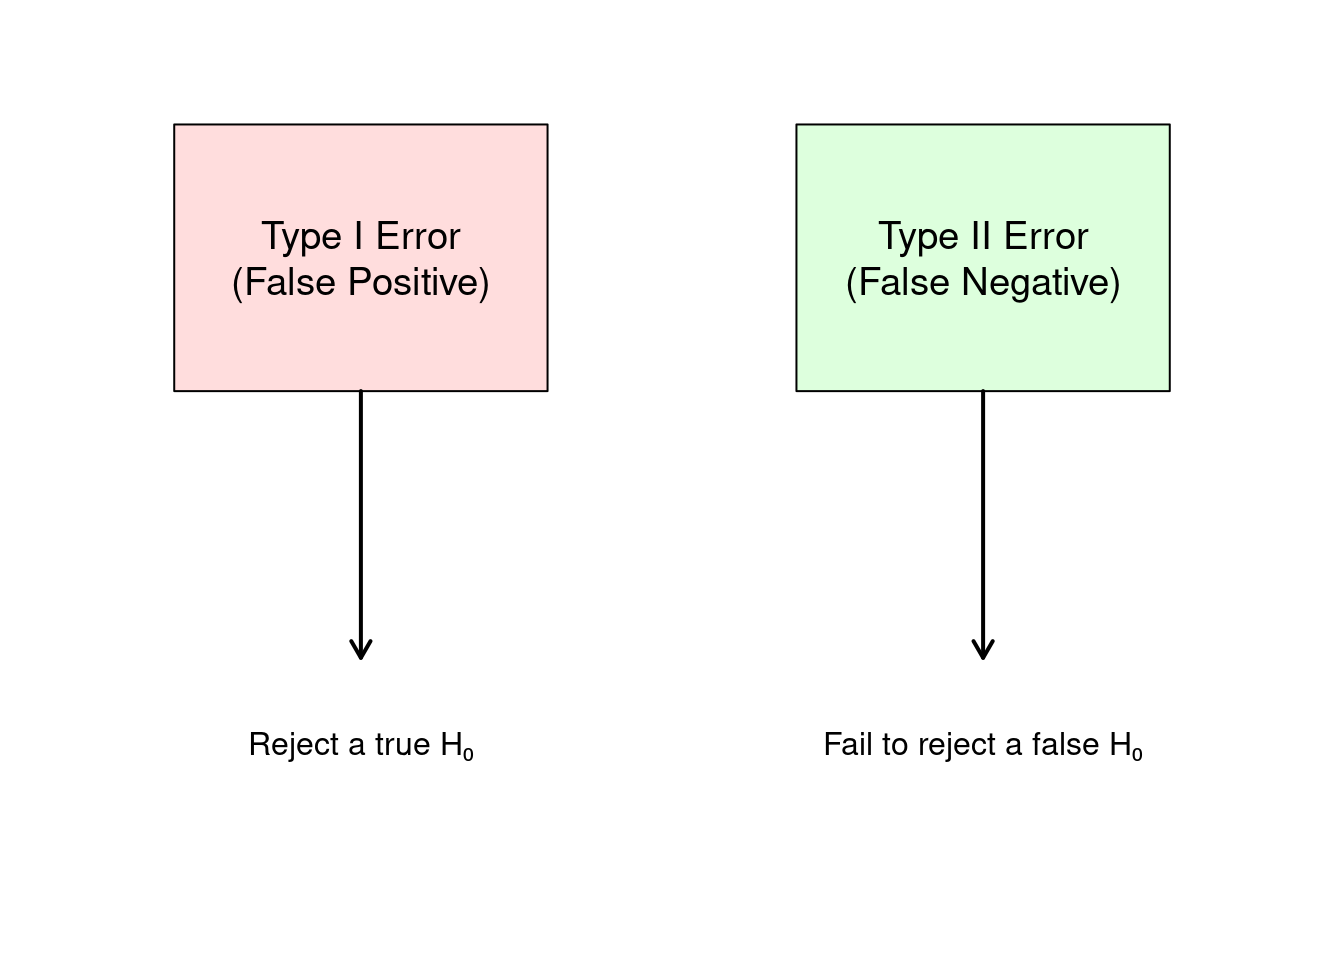
alternative hypothesis: true p is not equal to 0.5
95 percent confidence interval:
0.5161969 0.6028882
sample estimates:
p
0.56
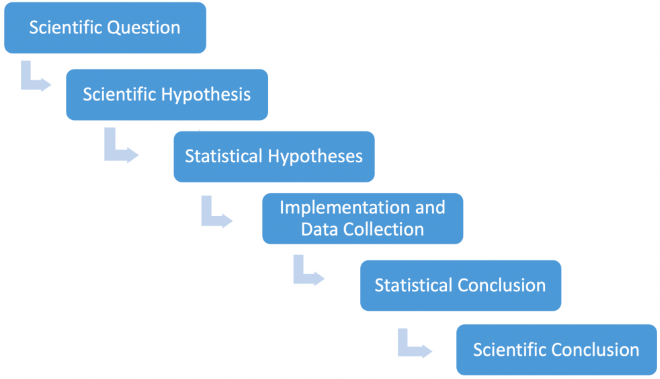
Slide 6: Hypothesis Testing
\[\text{Null Hypothesis} ~~~~H_0: p = p_0\]\[\text{Alternatives Hypothesis} ~~~~H_a: p < p_0~~~ (left.sided)\]\[\text{Alternatives Hypothesis} ~~~~H_a: p > p_0~~~ (right.sided)\]\[\text{Alternatives Hypothesis} ~~~~H_a: p \neq p_0~~~ (two.sided)\]
Slide 7: Quality Control Case
Scenario:
Claim: Defects > 5%
Found: 22 defects in 300
prop.test(22, 300, p =0.05, alternative ="greater", correct =FALSE)
    1-sample proportions test without continuity correction

data:  22 out of 300, null probability 0.05
X-squared = 3.4386, df = 1, p-value = 0.03184
alternative hypothesis: true p is greater than 0.05
95 percent confidence interval:
 0.05220849 1.00000000
sample estimates:
         p
0.07333333